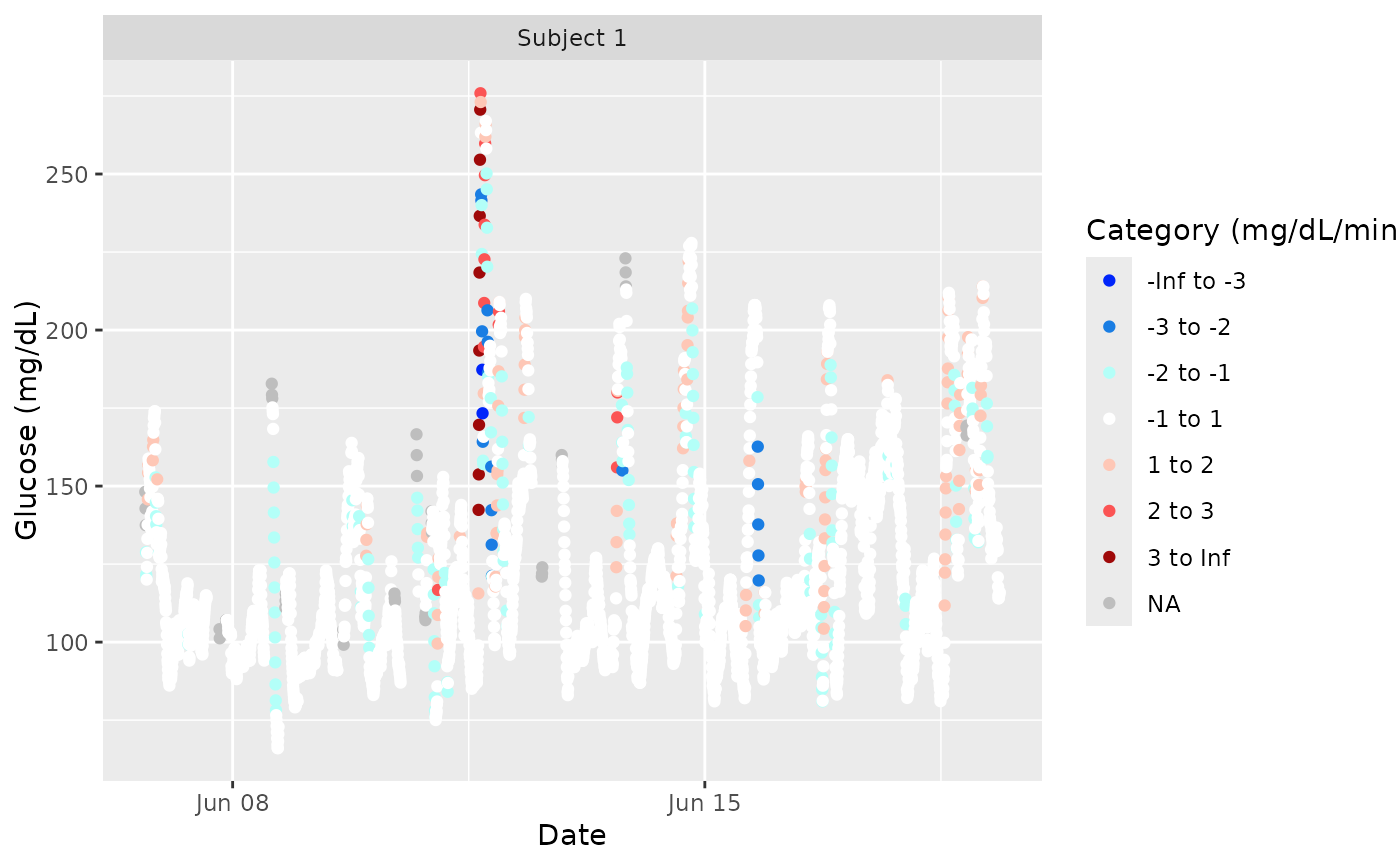
The function plot_roc produces a time series plot of glucose values colored by categorized rate of change values
Arguments
- data
DataFrame object with column names "id", "time", and "gl".
- subjects
String or list of strings corresponding to subject names in 'id' column of data. Default is all subjects.
- timelag
Integer indicating the time period (# minutes) over which rate of change is calculated. Default is 15, e.g. rate of change is the change in glucose over the past 15 minutes divided by 15.
- dt0
The time frequency for interpolation in minutes, the default will match the CGM meter's frequency (e.g. 5 min for Dexcom).
- inter_gap
The maximum allowable gap (in minutes) for interpolation. The values will not be interpolated between the glucose measurements that are more than inter_gap minutes apart. The default value is 45 min.
- tz
A character string specifying the time zone to be used. System-specific (see
as.POSIXct), but " " is the current time zone, and "GMT" is UTC (Universal Time, Coordinated). Invalid values are most commonly treated as UTC, on some platforms with a warning.
Details
For the default, a time series is produced for each subject in which the glucose values are plotted and colored by ROC categories defined as follows. The breaks for the categories are: c(-Inf, -3, -2, -1, 1, 2, 3, Inf) where the glucose is in mg/dl and the ROC values are in mg/dl/min. A ROC of -5 mg/dl/min will thus be placed in the first category and colored accordingly. The breaks for the categories come from the reference paper below.
References
Klonoff, D. C., & Kerr, D. (2017) A Simplified Approach Using Rate of Change Arrows to Adjust Insulin With Real-Time Continuous Glucose Monitoring. Journal of Diabetes Science and Technology 11(6) 1063-1069, doi:10.1177/1932296817723260 .

