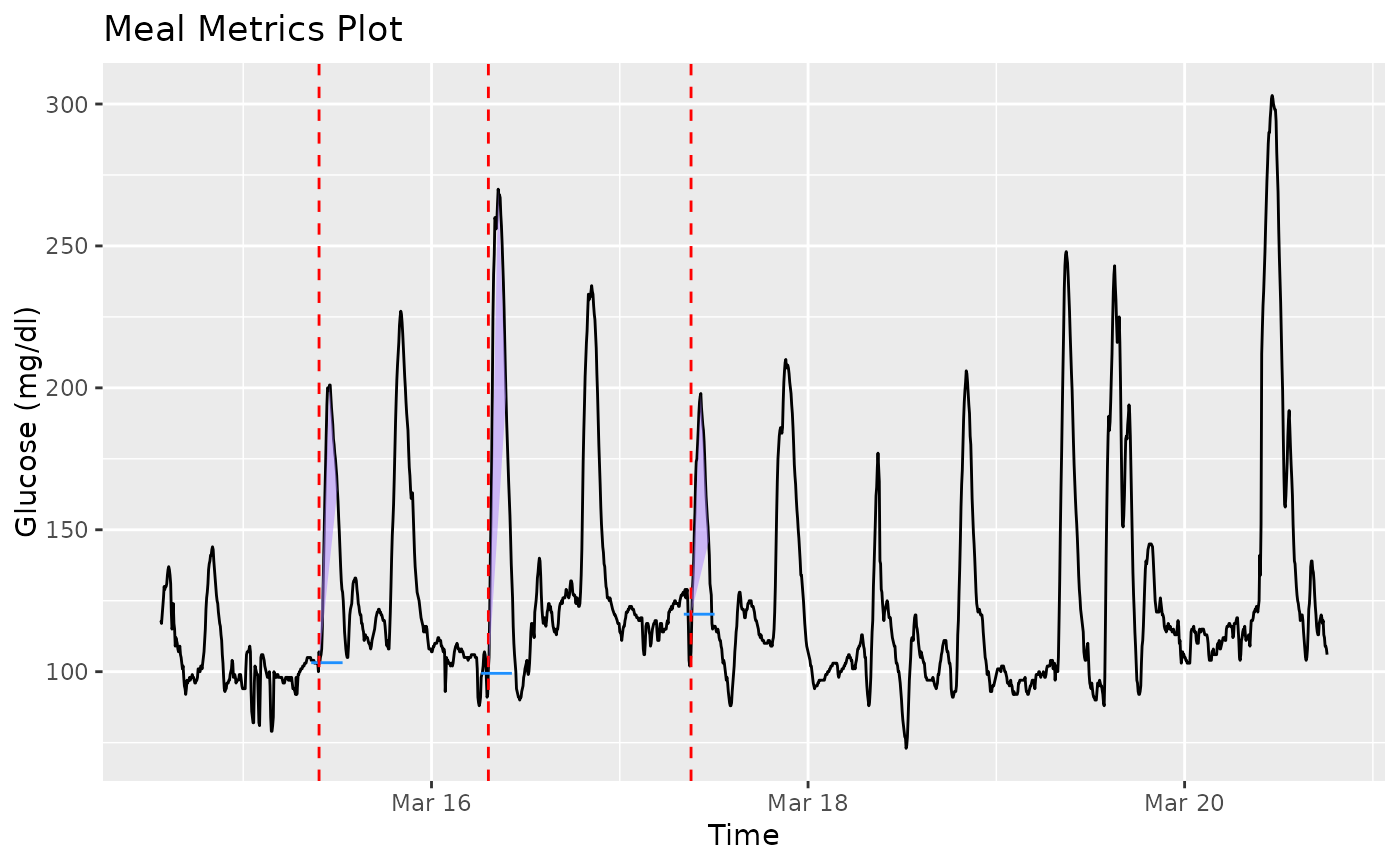
The function plot_meals produces a visual for meals data
Usage
plot_meals(data, mealtimes, plot_type=c('ggplot','plotly'), tz = "")Arguments
- data
DataFrame object with column names "id", "time", and "gl". Should only be data for 1 subject. In case multiple subject ids are detected, a warning is produced and only 1st subject is used.
- mealtimes
Either a vector of mealtimes, corresponding to data being from a single subject, OR a dataframe with at least 2 columns labeled id and mealtime. Optionally the mealtimes dataframe can include a column labeled meal, giving the meal type (helps to compensate for overlapping meals)
- plot_type
Default: "ggplot". One of 'ggplot', 'plotly'. Determines whether the function returns a static publication-ready image or an interactive GUI.
- tz
Default: "". A character string specifying the time zone to be used. System-specific (see
as.POSIXct), but " " is the current time zone, and "GMT" is UTC (Universal Time, Coordinated). Invalid values are most commonly treated as UTC, on some platforms with a warning.
Details
Only a single subject's data may be plotted. The solid black line is the glucose trace. Vertical dashed red lines show the mealtimes, and the horizontal blue lines show the baseline for each meal. Purple triangles are plotted to illustrate the 3 meal_metrics Namely the three vertices show the baseline, peak, and 1hr post-peak recovery. If plot_type = 'plotly', plotly is used to display an interactive visual that allows one to zoom into specific areas of the plot.
References
Service, F. John. (2013) Glucose Variability, Diabetes 62(5): 1398-1404, doi:10.2337/db12-1396
