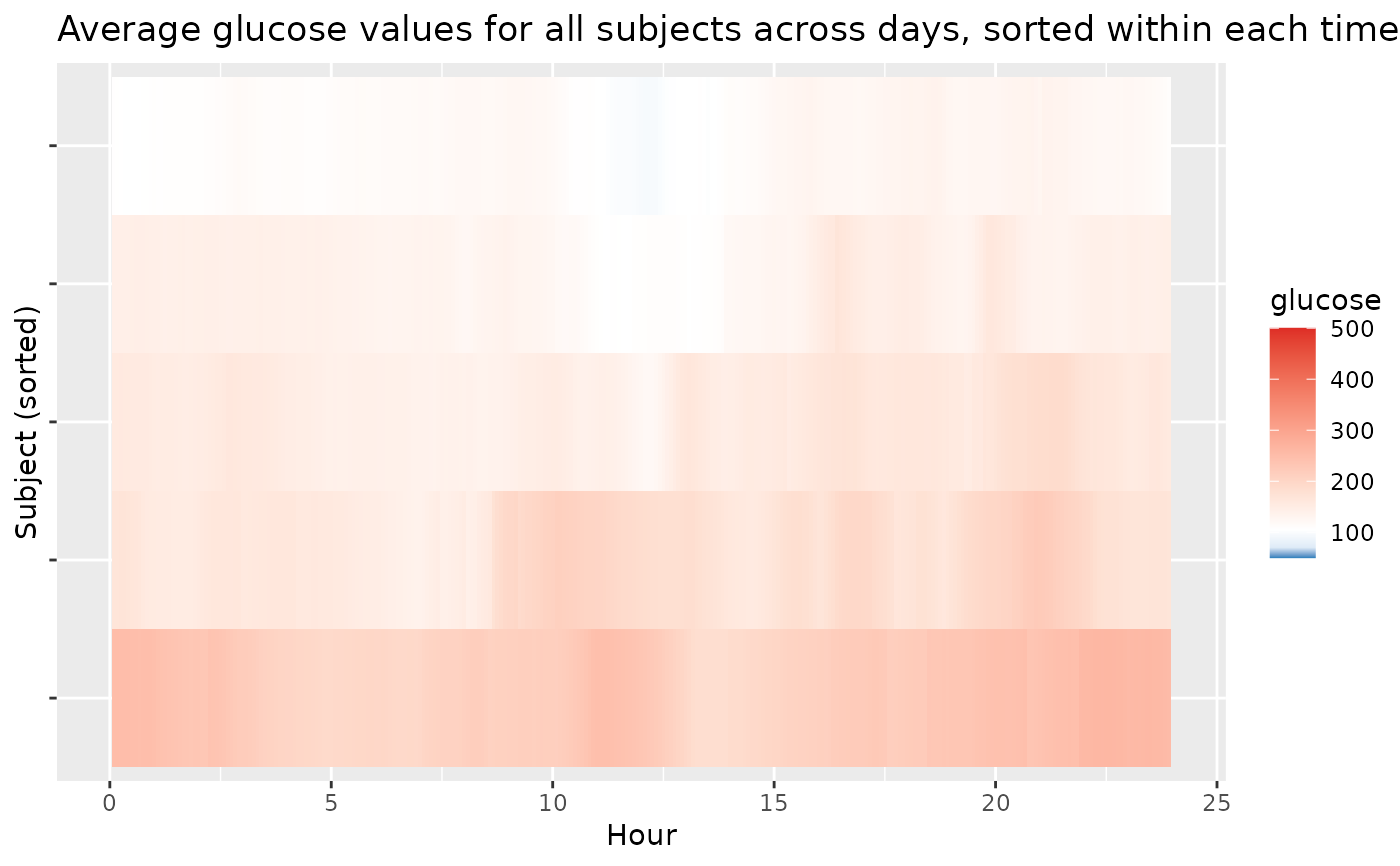
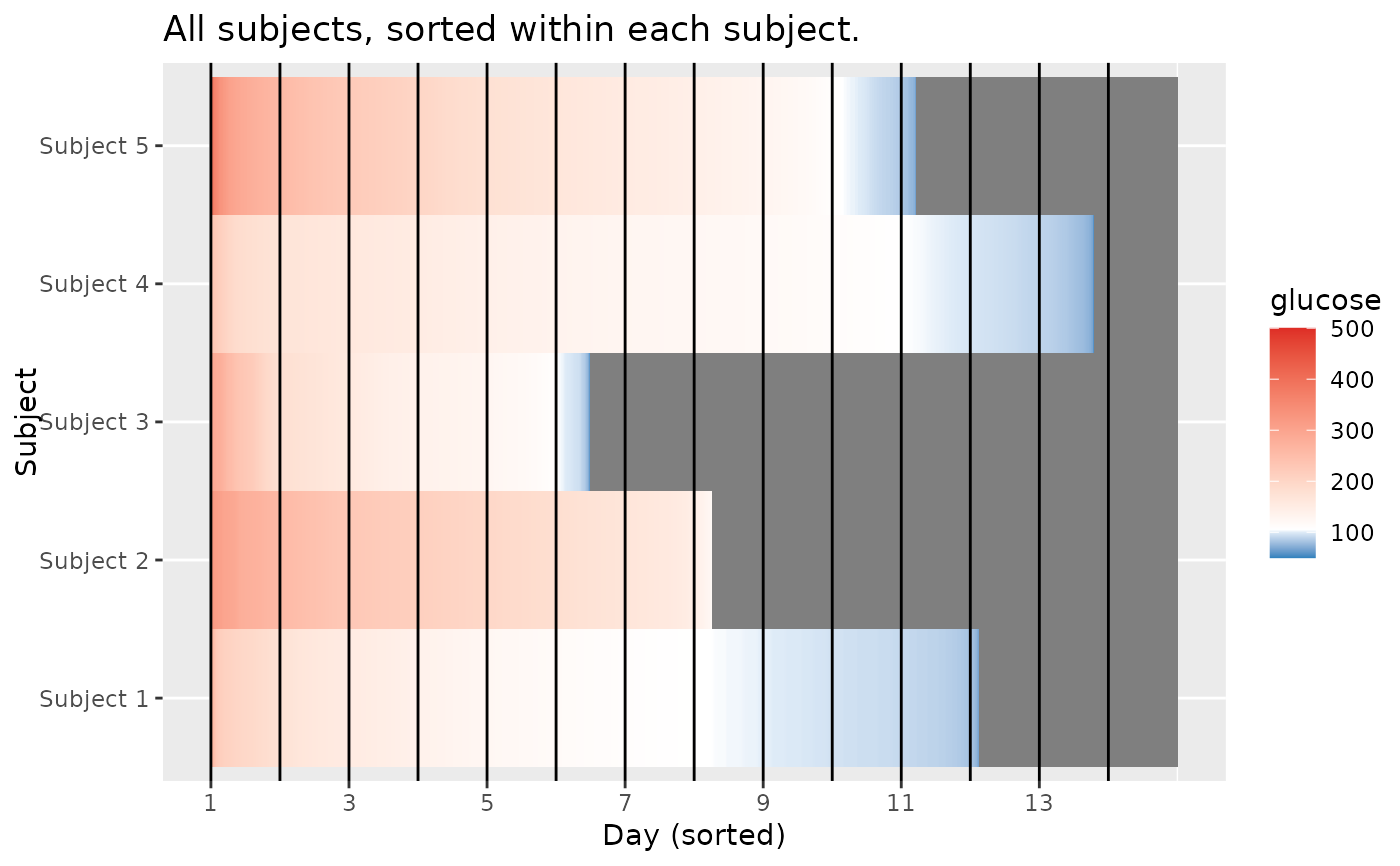
Lasagna plot of glucose values for multiple subjects
Usage
plot_lasagna(
  data,
  datatype = c("all", "average"),
  lasagnatype = c("unsorted", "timesorted", "subjectsorted"),
  maxd = 14,
  limits = c(50, 500),
  midpoint = 105,
  LLTR = 70,
  ULTR = 180,
  dt0 = NULL,
  inter_gap = 45,
  tz = "",
  color_scheme = c("blue-red", "red-orange"),
  log = F,
  static_or_gui = c("ggplot", "plotly")
)
Arguments
- data
DataFrame object with column names "id", "time", and "gl".
- datatype
String corresponding to data aggregation used for plotting, currently supported options are 'all' which plots all glucose measurements within the first
maxddays for each subject, and 'average' which plots average 24 hour glucose values across days for each subject- lasagnatype
String corresponding to plot type when using
datatype = "average", currently supported options are 'unsorted' for an unsorted lasagna plot, 'timesorted' for a lasagna plot with glucose values sorted within each time point across subjects, and '`subjectsorted`' for a lasagna plot with glucose values sorted within each subject across time points.- maxd
For datatype "all", maximal number of days to be plotted from the study. The default value is 14 days (2 weeks).
- limits
The minimal and maximal glucose values for coloring grid which is gradient from blue (minimal) to red (maximal), see
scale_fill_gradient2)- midpoint
The glucose value serving as midpoint of the diverging gradient scale (see
scale_fill_gradient2). The default value is 105 mg/dL. The values above are colored in red, and below in blue in the default color_scheme, which can be adjusted.- LLTR
Lower Limit of Target Range, default value is 70 mg/dL.
- ULTR
Upper Limit of Target Range, default value is 180 mg/dL.
- dt0
The time frequency for interpolated aligned grid in minutes, the default will match the CGM meter's frequency (e.g. 5 min for Dexcom).
- inter_gap
The maximum allowable gap (in minutes) for interpolation of NA glucose values. The values will not be interpolated between the glucose measurements that are more than inter_gap minutes apart. The default value is 45 min.
- tz
A character string specifying the time zone to be used. System-specific (see
as.POSIXct), but " " is the current time zone, and "GMT" is UTC (Universal Time, Coordinated). Invalid values are most commonly treated as UTC, on some platforms with a warning.- color_scheme
String corresponding to the chosen color scheme. By default, 'blue-red' scheme is used, with the values below `LLTR` colored in shades of blue, and values above `ULTR` colored in shades of red. The alternative 'red-orange' scheme mimics AGP output from
agpwith low values colored in red, in-range values colored in green, and high values colored in yellow and orange.- log
Logical value indicating whether log10 of glucose values should be taken, default value is FALSE. When log = TRUE the glucose values, limits, midpoint, LLTR, and ULTR will all be log transformed.
- static_or_gui
One of "ggplot" or "plotly". Default: "plotly". Returns either a ggplot (static image) or Plotly chart (interactive GUI).
References
Swihart et al. (2010) Lasagna Plots: A Saucy Alternative to Spaghetti Plots, Epidemiology 21(5), 621-625, doi:10.1097/EDE.0b013e3181e5b06a
Examples
plot_lasagna(example_data_5_subject, datatype = "average", lasagnatype = 'timesorted', tz = "EST")
#> Warning: Removed 5 rows containing missing values or values outside the scale range
#> (`geom_tile()`).

plot_lasagna(example_data_5_subject, lasagnatype = "subjectsorted", LLTR = 100, tz = "EST")
