The function `plot_daily` plots daily glucose time series profiles for a single subject.
Arguments
- data
DataFrame with column names ("id", "time", and "gl").
- maxd
Default: 14. Number of days to plot. If less than `maxd` days of data are available, all days are plotted.
- LLTR
Default: 70. Lower Limit of Target Range in mg/dL.
- ULTR
Default: 180. Upper Limit of Target Range in mg/dL.
- inter_gap
Default: 45. The maximum allowable gap (in minutes). Gaps larger than this will not be connected in the time series plot.
- tz
A character string specifying the time zone to be used. System-specific (see
as.POSIXct), but " " is the current time zone, and "GMT" is UTC (Universal Time, Coordinated). Invalid values are most commonly treated as UTC, on some platforms with a warning.
Details
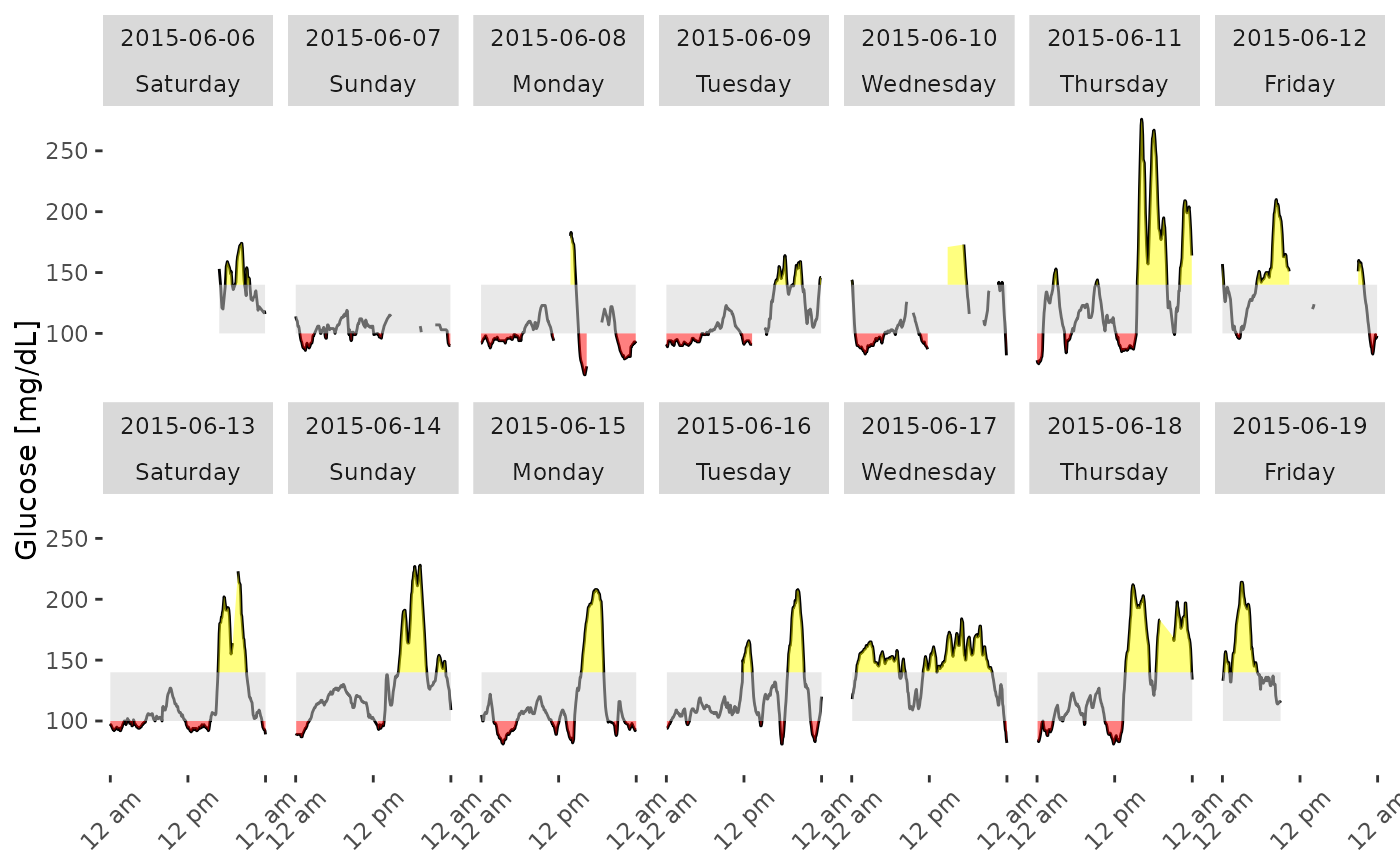
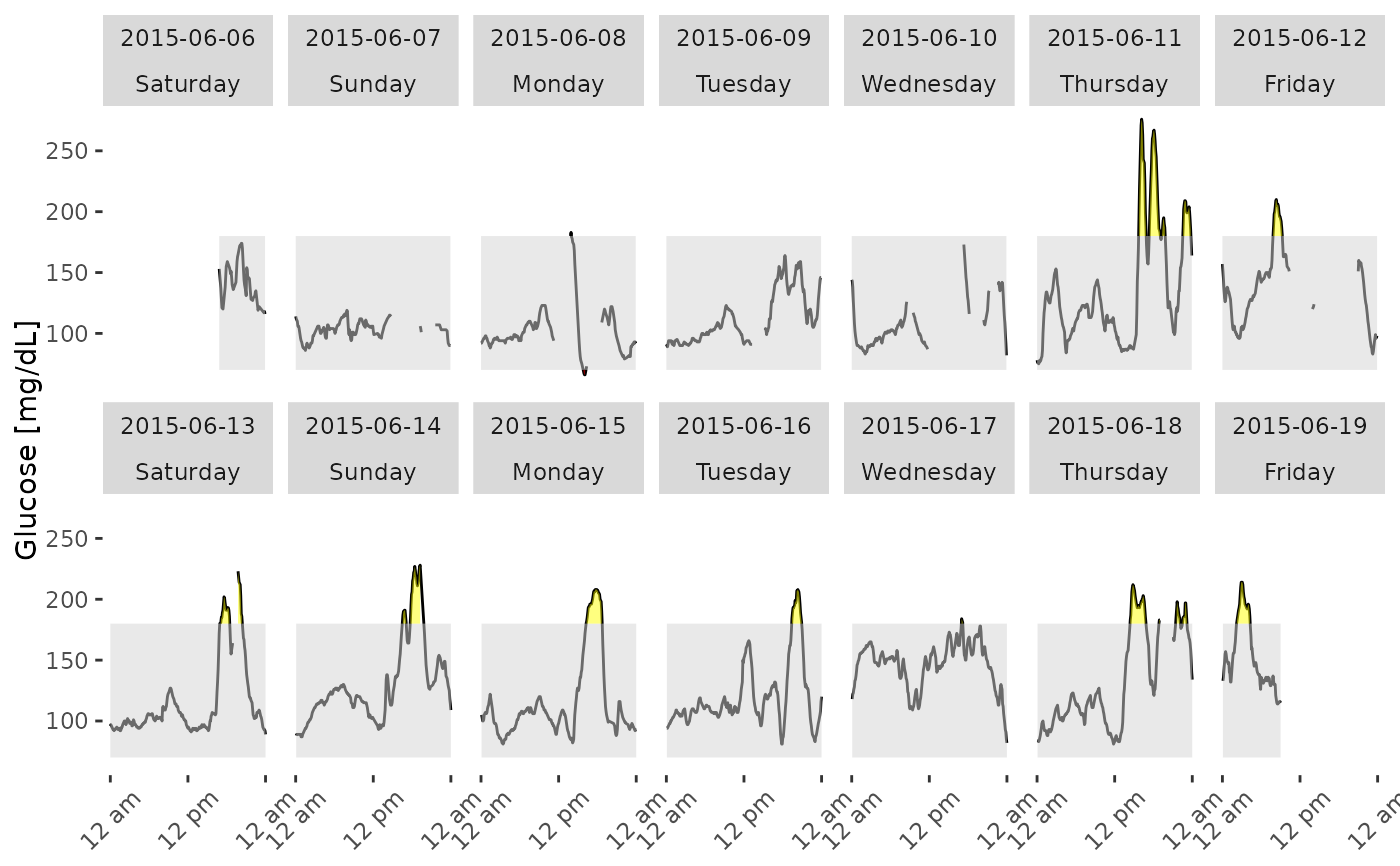
Only a single subject's data may be plotted. The black line shows the glucose values. The shaded gray area shows the target range, default 70-180 mg/dL. Areas of the curve above the ULTR are shaded yellow, while areas below the LLTR are shaded red.
References
Johnson et al. (2019) Utilizing the Ambulatory Glucose Profile to Standardize and Implement Continuous Glucose Monitoring in Clinical Practice, Diabetes Technology and Therapeutics 21:S2 S2-17-S2-25, doi:10.1089/dia.2019.0034 .
Examples
data(example_data_1_subject)
plot_daily(example_data_1_subject)

plot_daily(example_data_1_subject, LLTR = 100, ULTR = 140)